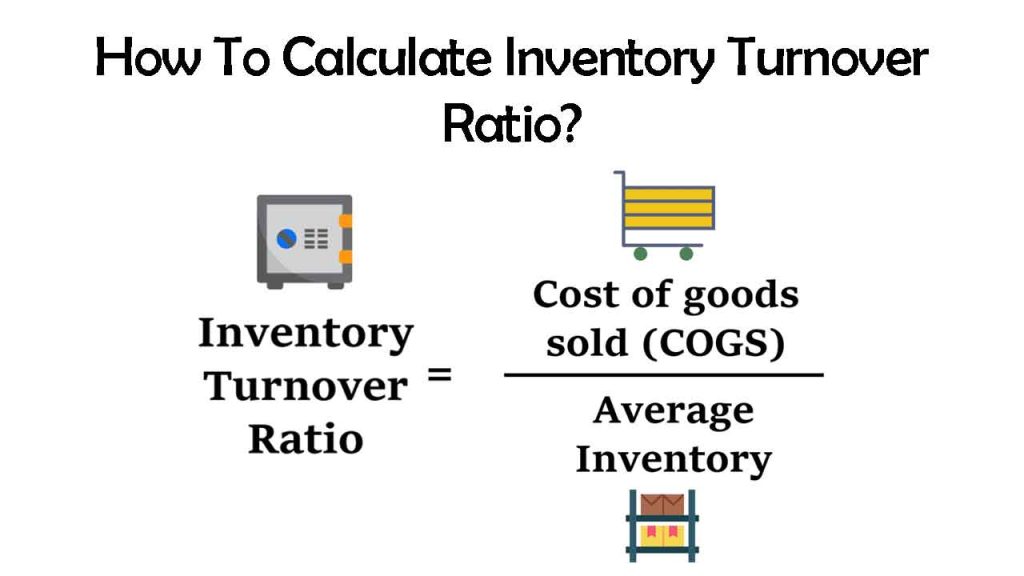
Inventory turnover ratio is a financial ratio that maintains a relationship between sales expense, also known as cost of products sold, and average inventory kept over the time. It’s also known as a stock turnover ratio.
The stock turnover ratio shows just how much of the company’s inventory has been turned into revenue. In other words, the number of times the business’s inventory is sold over the year.
Inventory Turnover Ratio Formula

Inventory Turnover Ratio = Cost of goods sold / Average Inventory
What is the Cost of Goods Sold?
In this case, the COGS is simply the cost of profits from activities. Your revenues are referred to as revenue from operations. As a result, the cost of sales is the real amount of inventory turned into sales.
The cost of goods sold is essentially calculated by subtracting the benefit from the sales produced. Simply put, lowering sales profit.
Profit in this context refers to gross profit. This is due to the fact that net profit involves additional costs that cannot be traced to stock.
It is also possible that you would suffer a loss on the selling of goods. The COGS is then calculated by applying the gross loss to the COGS.
What is the Average Inventory?
The average inventory is the sum of stock that a company keeps on reserve for a prolonged span of time It is determined by averaging of stock at the beginning & end of the year.
Average Inventory = Opening stock + Closing stock / 2
So, if opening inventory is 65.000 and closing stock is 35,000. So average inventory will be
65,000 + 35,000/2 = 1,00,000/2
= 50,000
Calculate Inventory Turnover Ratio – Example
Abc ltc is a manufacturing company and for the financial year 2021 they have Cost of goods sold of 5,00,000. Their opening stock was 2,60,000 and closing stock was 2,35,000. Find stock turnover ratio.
Average stock = 2,60,000 + 2,35,000/2
= 5,00,000/2
= 2,50,000
Inventory Turnover Ratio = Cost of goods sold / Average Inventory
5,00,000 / 2,50,000 = 2:1
A strong stock turnover ratio indicates that an organization employs effective inventory management mechanisms in conjunction with reasonable pricing policies. It illustrates how effective you are at turning stock into revenue. A higher ratio in this case is a good sign for any company.
But on the other hand, it is normal for a business to have a negative or poor product turnover ratio. This suggests a lack of interest, an aging commodity, or a bad selling/inventory strategy, among other things. A poor stock turnover ratio places the company at risk which can result in any of the problems mentioned below.
- Working capital that should have been put to better use elsewhere.
- Stock stacking up, leading in heavy storage and holding cost.
- The danger of a stock being obsolete or out of style, particularly in the consumer goods industry.
- Because of the waiting time, there is a high risk of spoilage in storage.


